
Botree DMS
Streamline distribution and boost primary sales efficiency.

Botree FlexiDMS
Access secondary data seamlessly without daily disruption.

Botree MyDMS
Empower distributors and accelerate rurban market growth.

Botree SFA
Boost sales productivity and ensure in-store excellence.

Botree Retailer App
Enhance retailer engagement with modern mobile app.

Botree AI
Make smarter decisions with granular insightful dashboards.

Christina Evangelin Ebinezer
Marketing AssociateUpdated on August 18, 2026



Supply chain visibility refers to the ability of a firm to track the location of goods, orders, and inventory within the entire supply chain, from suppliers and raw materials up front through to distributors, retailers, and consumers at the other end.
While a majority of definitions surrounding the concept of supply chain visibility tend to give significant attention to suppliers, shipments, and inbound logistics, the back-end aspect of supply chain visibility – post-manufacture delivery of products – is frequently overlooked despite being potentially more fragmented in firms which rely heavily on distribution.
This guide will cover everything you need to know about supply chain visibility, including how upstream and downstream visibility differ, the layers involved, key performance indicators used for measuring visibility and methods for improving visibility throughout the supply chain.
The term supply chain visibility refers to a firm having access to accurate information regarding its inventory, product orders, and movements throughout all stages of the supply chain process. It involves having a variety of data feeds and systems in place rather than installing one piece of software into the system for supply chain management purposes.
A firm with good visibility in its supply chain can easily determine the whereabouts of shipments, the quantity of products held by the distributor, if there is any product shortage at the retail level, or how a disruption in the upstream part will affect its final delivery. A firm without good visibility in its supply chain does all of this on the basis of outdated or no information at all.
| Aspect | Supply Chain Visibility | Supply Chain Transparency |
|---|---|---|
| What it answers | Where are my goods, orders, and inventory right now? | How and where were my goods produced, and under what conditions? |
| Primary audience | Internal teams — operations, sales, supply chain | External stakeholders — customers, regulators, investors |
| Focus | Operational: location, status, movement, stock levels | Ethical/sourcing: origin, labour practices, sustainability |
| Typical output | Dashboards, real-time tracking, inventory data | Sourcing disclosures, certifications, public reporting |
A business can have strong visibility without much transparency, and vice versa. This article focuses on visibility – the operational, internal-facing capability – rather than transparency.
Supply chain visibility can be understood through two broad sides of the network.
Supplier → Manufacturer → Distributor → Retailer → Consumer
Everything feeding into production sits largely on the upstream side.
Everything moving from the manufacturer toward the market sits on the downstream side.
| Aspect | Upstream Visibility | Downstream Visibility |
|---|---|---|
| Covers | Suppliers, raw materials, inbound shipments, production | Distributors, retailers, and consumer-facing sell-through |
| Typical data source | Supplier systems, procurement, inbound logistics/ERP | Distributor DMS, retailer POS, field sales apps |
| Common tools | ERP, procurement platforms, logistics control towers | DMS, SFA, retailer apps |
| Where it usually breaks | Tier-2/3 supplier data, in-transit shipment updates | Beyond the distributor — secondary and tertiary sales |
| Business impact if missing | Production delays, input shortages | Stockouts, lost sell-through, poor demand signal |
Supply chain visibility becomes easier to manage when broken into specific layers.
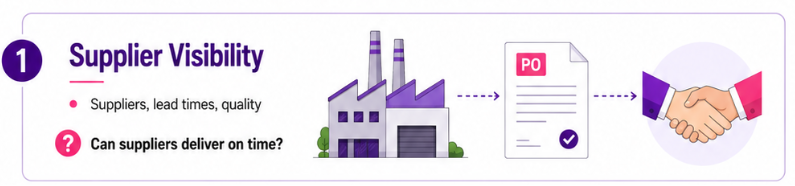
1. Supplier Visibility
Provides insight into what’s going on within the supply chain partner firms that supply us with materials, components, or services – order status, lead times, capacity, on time performance, quality issues, and Tier 2 dependencies. Provides answer to questions such as are our suppliers able to provide us with what we need and when. Information sources: supplier portal, procurement system, ERP, supplier integrations.
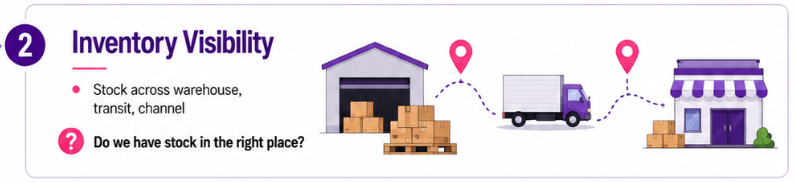
2. Inventory Visibility
Gives information about current inventories and their locations – raw materials, works in process, finished goods, warehouse inventories, in transit inventories, distributor inventories, retail inventories where available. Answering question like are we have enough products in sufficient amounts in the right places. 10,000 units sitting in wrong warehouse or wrong distributor location won’t help with a stockout at some other location.
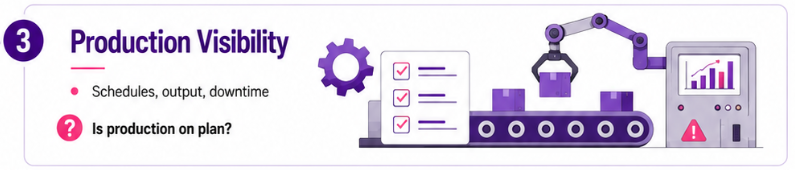
3. Production Visibility
Shows what’s going on in manufacturing operations – production schedule, work orders, capacity, output, down time, material availability, and exceptions. Provides answer to question: what are we producing and is our production matching the plan. Source of information is usually manufacturing, ERP, and plant systems.
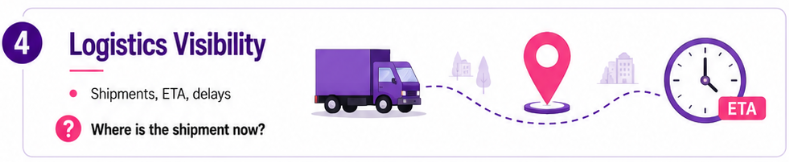
4. Logistics Visibility
Deals with movement of goods from one place to another including such details as shipment location, carrier status, arrival estimates, shipping delays, milestone deliveries, proof of delivery, and transportation exceptions. The question it seeks to answer is: Where is the shipment, and how long before it arrives? This is one of the most common visibility areas because of the now routine shipment tracking process.
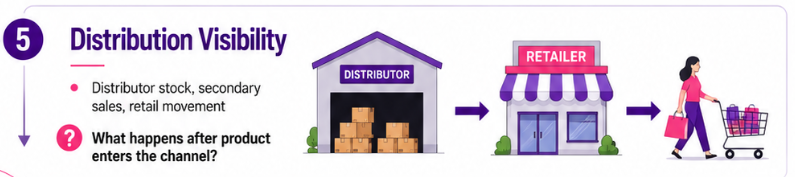
5. Distribution Visibility
Moves beyond the company’s warehouse to look at the downstream sales and distribution chain including distributor inventories, secondary sales, retailer orders, fill rates, coverage, movement, schemes, and retail availability. The question it tries to answer is: What is happening to our product once it gets into the channel? For companies that rely heavily on distributors and retailers, this is often the hardest layer to construct.
Take the case of an FMCG company launching a new beverage. It will make the product and invoice 10,000 cases to the distributor. That’s visible – it’s recorded in its ERP system with details of the invoice value, time and name of the distributor. But the story doesn’t end there.
The actual route can be anything from
Brand → Distributor → Retailer → Shopper, or in case of a different RTM strategy, Brand → C&F/Super Stockist → Distributor → Retailer → Shopper.
But think about the questions it needs answers to: How many cases remain with distributors? Which distributors are selling the product fastest? Which retailers are reordering? Where is there a stock out situation? In which SKU is there sales movement in general trade but not in modern trade? Is the distributor doing replenishment on the basis of true demand? There lies the problem of downstream visibility.
Primary Sales
Primary sales represents product sold by the company into its distributor network: Brand → Distributor. Primary data is normally easy for the brand to access, since the transaction occurs within systems it controls.
Secondary Sales
Secondary sales represents product moving from distributors to retailers: Distributor → Retailer. This is where visibility can weaken. Distributors may use different billing systems, accounting software, or operational processes; some information is collected manually, and other data arrives with delays. The brand knows what it sold into the distributor but may not immediately know what moved out of it.
Tertiary Sales
Tertiary sales represents the retailer selling to the final shopper: Retailer → Shopper. In fragmented retail channels, this can be even harder to observe consistently, since the brand may not directly control the retailer’s point-of-sale data.
| Challenge | Why It Happens | Practical Way to Address It |
|---|---|---|
| Fragmented data | Data sits in separate systems across suppliers, distributors, and retailers with no common structure | Standardise data capture formats before attempting to consolidate reporting |
| Different distributor systems | Distributors use varied or no digital systems, especially smaller ones | Offer a lightweight, low-friction capture tool distributors will actually adopt |
| Manual data collection | Orders, stock counts, and claims are still recorded on paper or spreadsheets in parts of the chain | Digitise the highest-value data capture points first, not the entire chain at once |
| Lack of ownership | No single team or role is accountable for chain-wide visibility | Assign clear ownership for closing specific, named visibility gaps |
| Delayed data | Data is reported periodically (weekly or monthly) instead of continuously | Set a target latency for critical data points and work backward from it |
Measuring visibility itself, not just supply chain performance, means tracking a mix of upstream and downstream KPIs. Most supply chain content is strong on the upstream set and largely silent on the downstream one.
| KPI | What It Tells You |
|---|---|
| Supplier on-time delivery | How reliably suppliers deliver against agreed schedules |
| Inbound lead-time variability | How consistent (or unpredictable) inbound delivery times are |
| Tier-2 coverage | How much visibility extends beyond direct, tier-1 suppliers |
| Forecast accuracy | How closely demand forecasts match actual demand |
| KPI | What It Tells You |
|---|---|
| Secondary sales reporting coverage | What share of distributors are actually reporting secondary sales data |
| Data latency | How much time passes between a sale happening and the brand seeing it |
| Numeric distribution | How many outlets are stocking the product |
| Fill rate | How much of an order is actually delivered against what was requested |
| Stockout rate | How often and how long outlets go without stock |
| Sell-in vs sell-out gap | The difference between what’s shipped to distributors and what actually sells through to consumers |
Visibility capability tends to develop in stages, and it’s useful for a business to know honestly which stage it’s actually operating from.
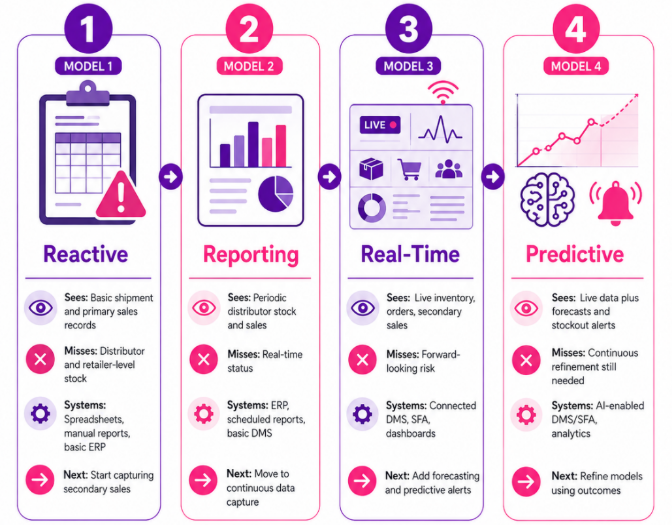
1. Reactive
At the reactive stage, visibility comes after the event. Teams depend on spreadsheets, manual reports, and basic ERP data to understand shipments and primary sales, while distributor and retailer-level activity remains difficult to see. The next step is to begin capturing downstream data, especially secondary sales, more consistently.
2. Reporting
At the reporting stage, the business has more structured visibility through periodic reports on inventory, distributor stock, and sales. However, gaps may only become visible after the reporting cycle closes. The focus should now shift from periodic reporting to more continuous data capture.
3. Real-Time
At the real-time stage, connected systems provide a current view of inventory, orders, shipments, and secondary sales. Teams can identify problems faster and respond while they are still happening. The next step is to use this live data for forecasting, alerts, and earlier risk detection.
4. Predictive
At the predictive stage, real-time visibility is combined with analytics and forecasting to anticipate stockouts, demand changes, and other potential disruptions. The business moves from simply seeing what is happening to understanding what is likely to happen next, with continuous refinement based on actual outcomes.
Different technologies solve different visibility gaps across the supply chain:
Botree enables distribution-focused organizations to improve their supply chain visibility from just being able to see within the manufacturer’s scope, but further down into the distributor, field sales, and retail environment. Through integration of inventory data, order data, secondary sales data, distributor data, and execution in outlets, organizations have a better sense of the movement of the product.
This downstream visibility enables teams to detect gaps in the inventory, assess distributor performance, measure secondary sales consistently, and make more informed replenishment decisions. In addition, downstream visibility lowers dependency on delayed and disjointed information by integrating important Route-to-Market data.
In large organizations that operate through a vast distributor and retail network, this is an easy transition from just being able to measure what was shipped to knowing where the products are, where they are being sold, and what needs to be done next.
Visibility in the supply chain is not only about tracing shipments or what is going on in a warehouse. Visibility is about connecting all links of the supply chain including suppliers, inventory, logistics, distributors, retailers, and market.
For those organizations whose success relies on their distribution processes, the main leverage comes from the downstream side. Being able to track what has been shipped can be helpful, but being aware of what is in the hands of distributors, what is being shipped to retailers, and where there are stock or execution shortages is what makes the difference.
Having the right technology in place, companies can start addressing issues earlier and make better Route to Market decisions.

Marketing Associate
Meet Christina Evangelin Ebinezer, our dynamic marketing associate at Botree Software. With a background in HR and marketing, and prior experience as a content writer, Christina brings a sharp eye for storytelling and a knack for crafting engaging blogs and marketing content. She’s passionate about turning ideas into words that drive impact. Outside of work, Christina finds joy behind the piano keys or the wheel—whether she’s playing a soulful tune or cruising down open roads.
What is supply chain visibility?
What is end-to-end supply chain visibility?
What is real-time supply chain visibility?
What is supply chain visibility software?
What is the difference between supply chain visibility and supply chain transparency?
What is distribution visibility?
How do you measure supply chain visibility?
Why is supply chain visibility important for FMCG and CPG businesses?

Stay updated with the latest trends and insights.